Compare your own scores with OceanBench
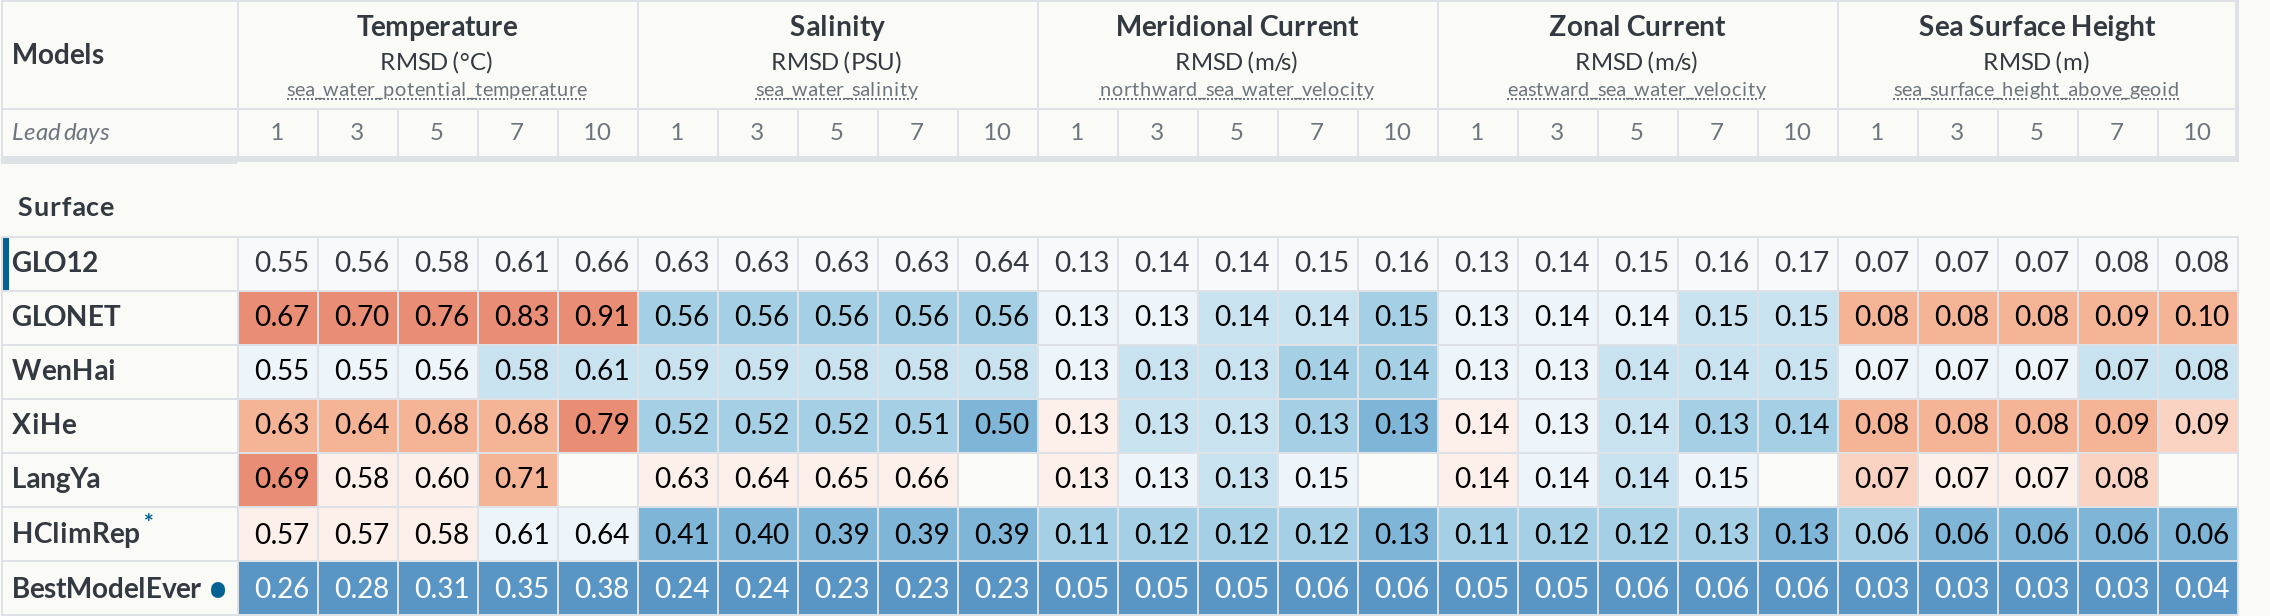
oceanbench evaluate writes the scores of your system in a scores file. You can now see it on the Scores page, as an extra row of the score tables, next to the published scores.
Add a scores file
In the Your scores row, click Add a scores file, then choose one or several files on your computer, or give a public URL, for example on S3. You can add up to 5 systems, each as its own row.
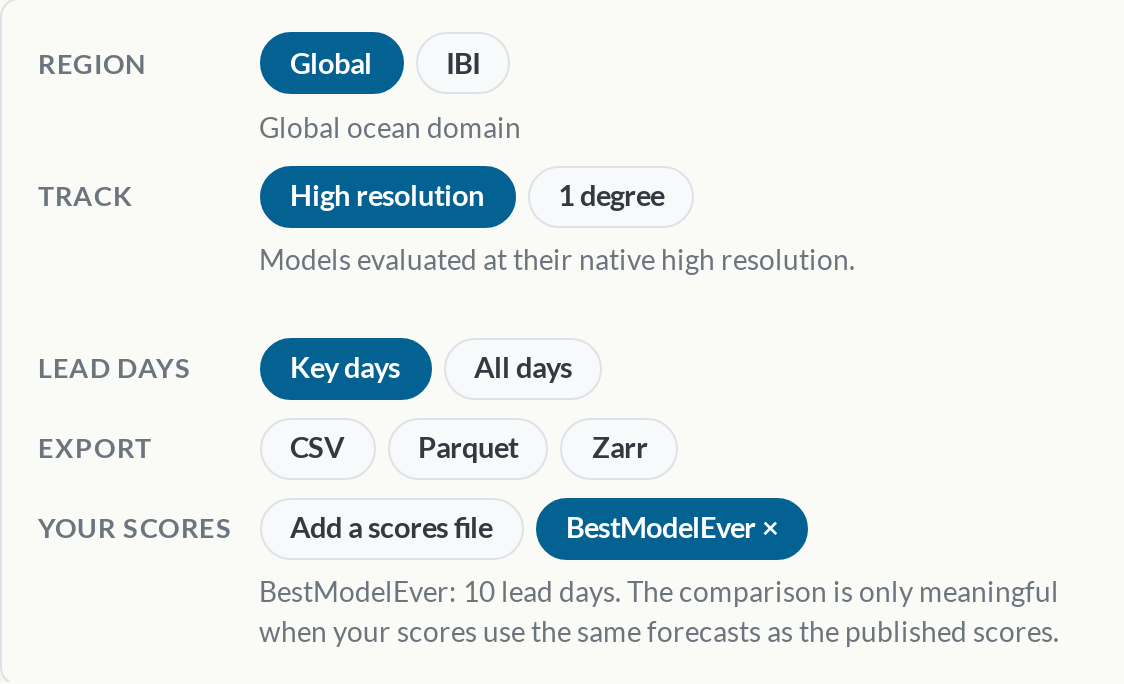
The file is read in your browser and is never uploaded. Your system appears in the tables with a blue circle marker, coloured like the other systems, as the difference to the selected baseline.
Try it
Open the Scores page with BestModelEver, a fake system that beats every other system, or download its scores file and add it yourself.
Show every lead day
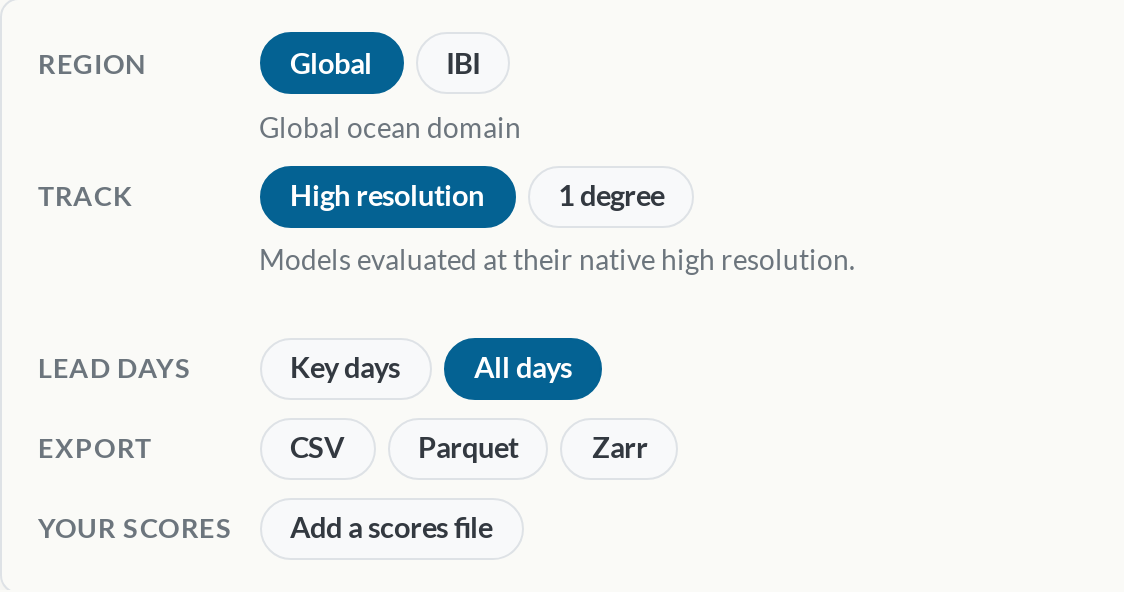
The tables show the key lead days (1, 3, 5, 7 and 10) by default. In the Lead days row, click All days to show all 10 lead days, for the published scores and for yours. The choice is kept in the page URL as ?lead_days=all.
What to expect
- The file is shown next to the published scores of its region. The compared version is selected automatically by default, and you can force it manually with Compare with in the dialog or
?compare_with=<version>in the page URL. - Scores are only comparable when the forecasts are the same. The page reminds you of it under the row.
- Only the scores the website already shows are displayed.